Apply IOM theme to a ggplot object
apply_theme.RdAdds thematic presets adhering to the IOM visual branding to a ggplot object. The function adjusts text sizes, colors, legend positioning, panel grids, and other visual elements based on the specified plot type.
Arguments
- type
Character. Type of plot to theme. One of "line", "bar-horizontal", "bar-vertical", "scatter", "map", or "void".
- basesize
Numeric. Base font size in points. Default is 7.
- font
Character. Font family for all text elements. Default is "Gill Sans Nova".
- facets
Logical. Whether the plot is faceted. Default is FALSE.
Details
The basesize parameter controls the base font size for axis labels, titles,
and plot annotations. The font parameter sets the font family.
The facets parameter specifies whether the plot uses faceting, which adjusts
the strip appearance accordingly.
Supported plot types:
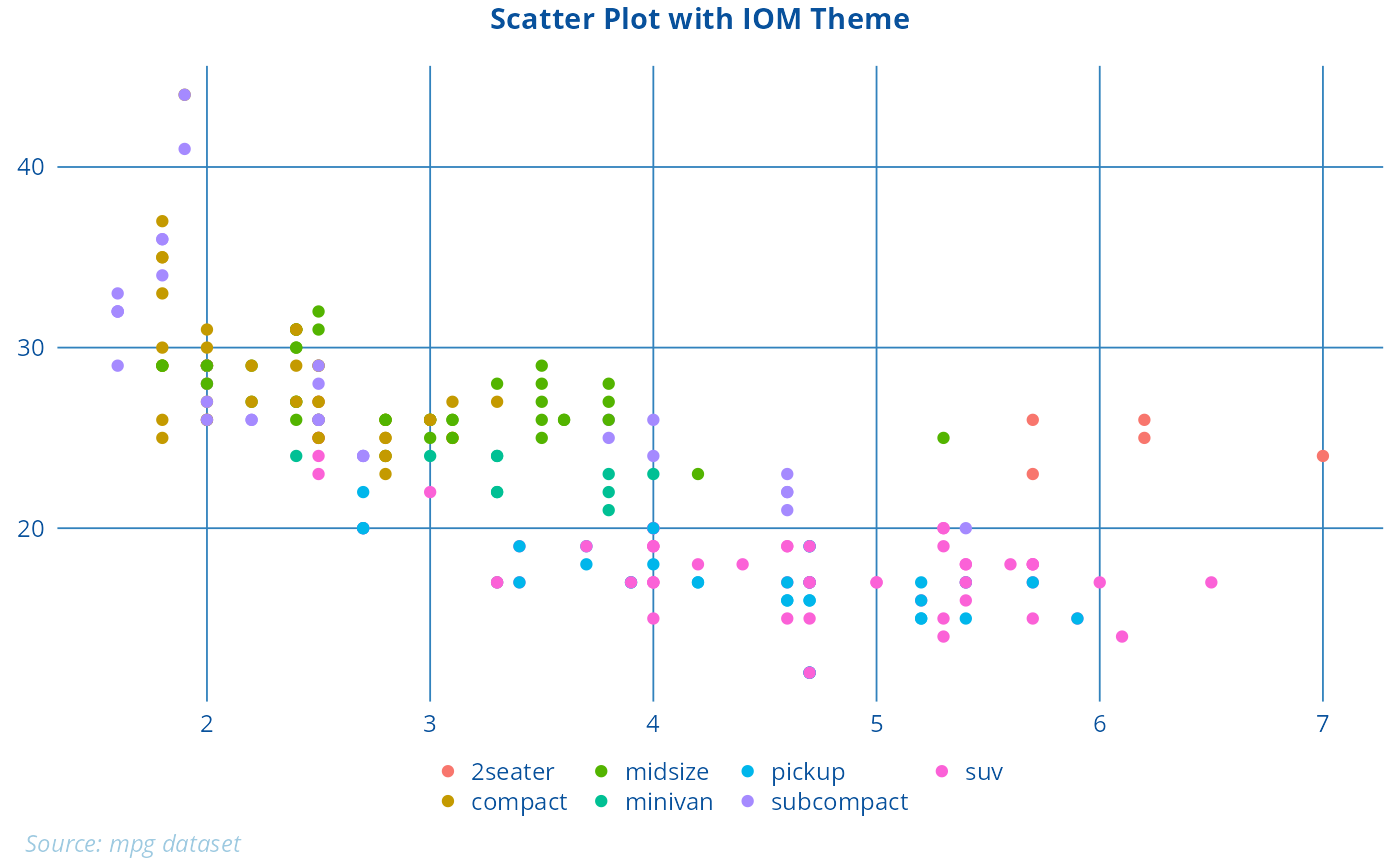
"line"- Line plots with appropriate legend keys and grid lines."bar-horizontal"- Horizontal bar plots with grid on x-axis."bar-vertical"- Vertical bar plots with grid on y-axis."scatter"- Scatter plots with grid lines."map"- Map plots with minimal axis text and no grid."void"- Empty theme (not implemented here, but can be added).
Examples
library(ggplot2)
#> Warning: package 'ggplot2' was built under R version 4.4.3

# Simple scatter plot with IOM theme
p <- ggplot(mpg, aes(displ, hwy, color = class)) +
  geom_point() +
  labs(
    title = "Scatter Plot with IOM Theme",
    caption = "Source: mpg dataset"
  ) +
  apply_theme(type = "scatter", basesize = 9)

p