Package Development Documentation through {fusen}
package-development-documentation-through-fusen.Rmd
library(amerdigest)
#> Registered S3 method overwritten by 'tsibble':
#>   method               from
#>   as_tibble.grouped_df dplyr
Theming
apply_theme
library(ggplot2)
#> Warning: package 'ggplot2' was built under R version 4.4.3

# Simple scatter plot with IOM theme
p <- ggplot(mpg, aes(displ, hwy, color = class)) +
  geom_point() +
  labs(
    title = "Scatter Plot with IOM Theme",
    caption = "Source: mpg dataset"
  ) +
  apply_theme(type = "scatter", basesize = 9)

p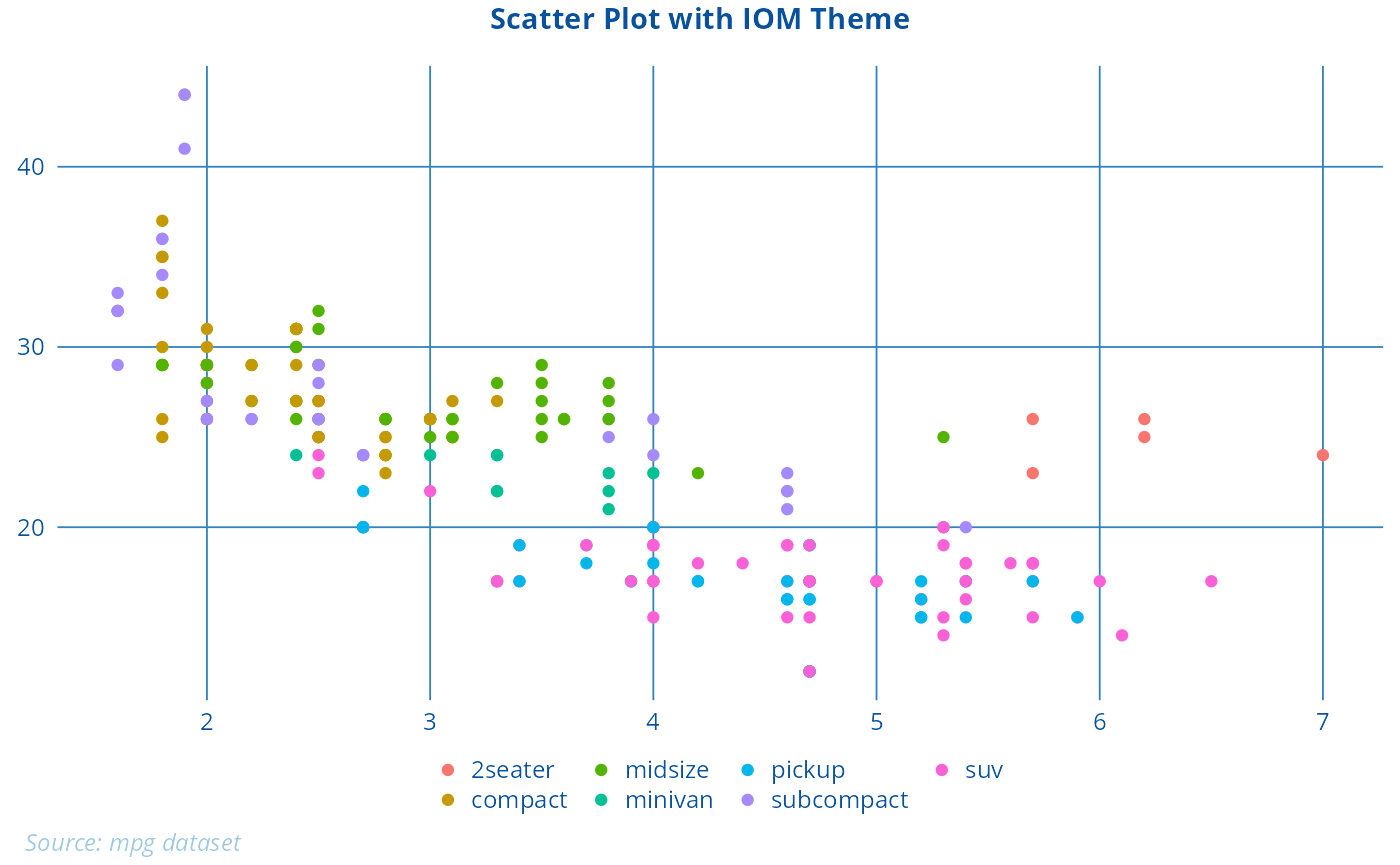
set_axis
set_axis(c(100, 500, 1000), units = "Persons")
#> $breaks
#> list()
#> attr(,"class")
#> [1] "waiver"
#>
#> $labels
#> list()
#> attr(,"class")
#> [1] "waiver"
#>
#> $title
#> [1] "Persons"
set_axis(c(5e8, 1.5e9), units = "USD")
#> $breaks
#> [1] 0.0e+00 5.0e+08 1.0e+09 1.5e+09
#>
#> $labels
#> [1] "0"   "0.5" "1.0" "1.5"
#>
#> $title
#> [1] "Billions USD"
plot_label
library(ggplot2)
p <- ggplot(mtcars, aes(x = wt, y = mpg)) + geom_point()
plot_label(p, "Fuel Efficiency", span = 2)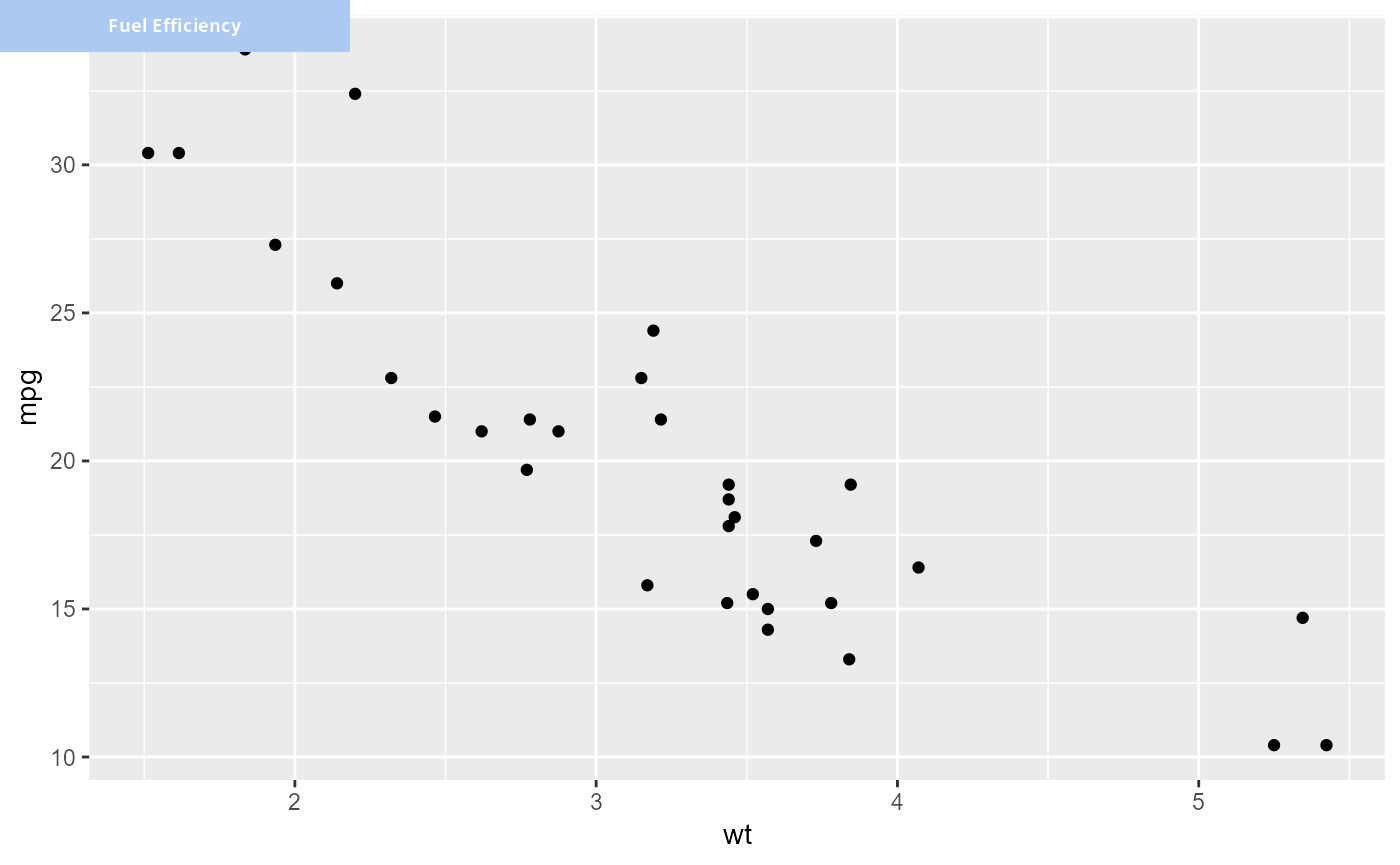
prettylabel
prettylabel(123456)                      # "123K"
#> [1] "123K"

prettylabel(123456789, spell = TRUE)     # "123 million"
#> [1] "123 million"

prettylabel(0.756, pct = TRUE)           # "75.6%"
#> [1] "0.76%"

prettylabel(1200, currency = "$")        # "$1.2K"
#> [1] "$1.2K"

prettylabel(c(1e6, 2e9), signif = 3)     # "1.00M" "2.00B"
#> [1] "1M" "2B"

prettylabel(NA)                          # NA
#> [1] NAFont Management
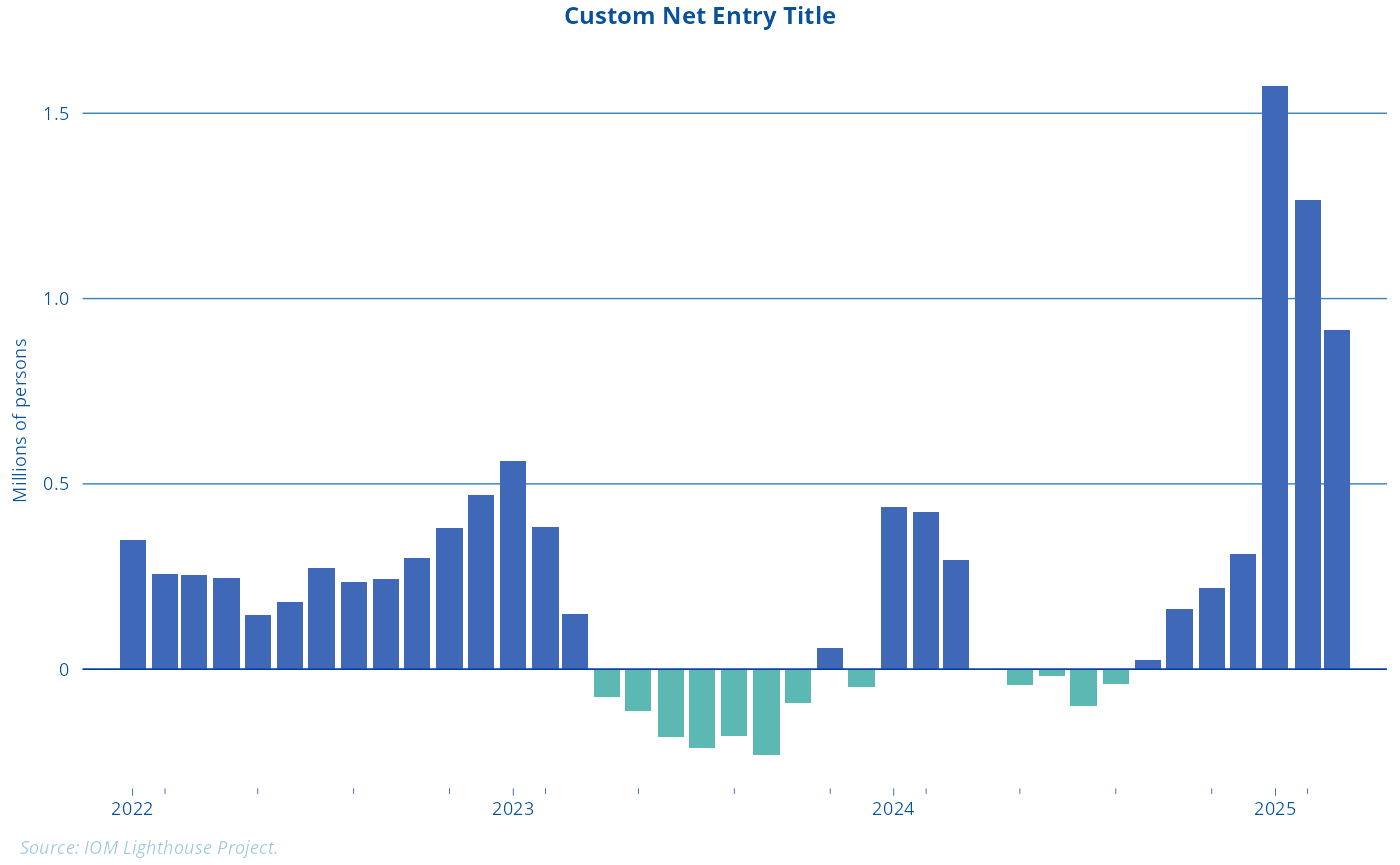
this part is check during the package load with the zzz.R function
package_font_installed
test <- systemfonts::system_fonts() |>
              dplyr::filter(  family == "Gill Sans Nova"  )
test
#> # A tibble: 8 × 9
#>   path                    index name  family style weight width italic monospace
#>   <chr>                   <int> <chr> <chr>  <chr> <ord>  <ord> <lgl>  <lgl>
#> 1 "C:\\Users\\elegoupil\…     0 Gill… Gill … Ultr… heavy  norm… FALSE  FALSE
#> 2 "C:\\Users\\elegoupil\…     0 Gill… Gill … Heav… ultra… norm… TRUE   FALSE
#> 3 "C:\\Users\\elegoupil\…     0 Gill… Gill … Heavy ultra… norm… FALSE  FALSE
#> 4 "C:\\Users\\elegoupil\…     0 Gill… Gill … Bold… bold   extr… FALSE  FALSE
#> 5 "C:\\Users\\elegoupil\…     0 Gill… Gill … Extr… heavy  norm… FALSE  FALSE
#> 6 "C:\\Users\\elegoupil\…     0 Gill… Gill … Medi… medium cond… TRUE   FALSE
#> 7 "C:\\Users\\elegoupil\…     0 Gill… Gill … Medi… medium cond… FALSE  FALSE
#> 8 "C:\\Users\\elegoupil\…     0 Gill… Gill … Extr… heavy  cond… FALSE  FALSE
package_font_installed()
#> [1] TRUE
Data
get_regflow
# Get all regional flows
all_flows <- get_regflow()

knitr::kable(head(all_flows,5))| geo | t | n | var |
|---|---|---|---|
| ARG | 2023 Jan | 1993127 | Entries |
| ARG | 2023 Feb | 1933049 | Entries |
| ARG | 2023 Mar | 1881628 | Entries |
| ARG | 2023 Apr | 1882274 | Entries |
| ARG | 2023 May | 1749469 | Entries |
# Get flows for USA only
usa_flows <- get_regflow("USA")

knitr::kable(head(usa_flows,5))| geo | t | n | var |
|---|---|---|---|
| USA | 2022 Jan | 381231 | Exits |
| USA | 2022 Feb | 288707 | Exits |
| USA | 2022 Mar | 401961 | Exits |
| USA | 2022 Apr | 381597 | Exits |
| USA | 2022 May | 351002 | Exits |
get_regnet
# Get net registrations for all geographies
net_all <- get_regnet()

knitr::kable(head(net_all,5))| geo | t | n_in | n_out | n |
|---|---|---|---|---|
| ARG | 2023 Jan | 1993127 | 473166 | 1519961 |
| ARG | 2023 Feb | 1933049 | 474376 | 1458673 |
| ARG | 2023 Mar | 1881628 | 266051 | 1615577 |
| ARG | 2023 Apr | 1882274 | 141310 | 1740964 |
| ARG | 2023 May | 1749469 | 96854 | 1652615 |
# Get net registrations for USA only

net_usa <- get_regnet("USA")

knitr::kable(head(net_usa,5))| geo | t | n_in | n_out | n |
|---|
digest_data
# Example usage assuming amerdigest and countrynames are loaded
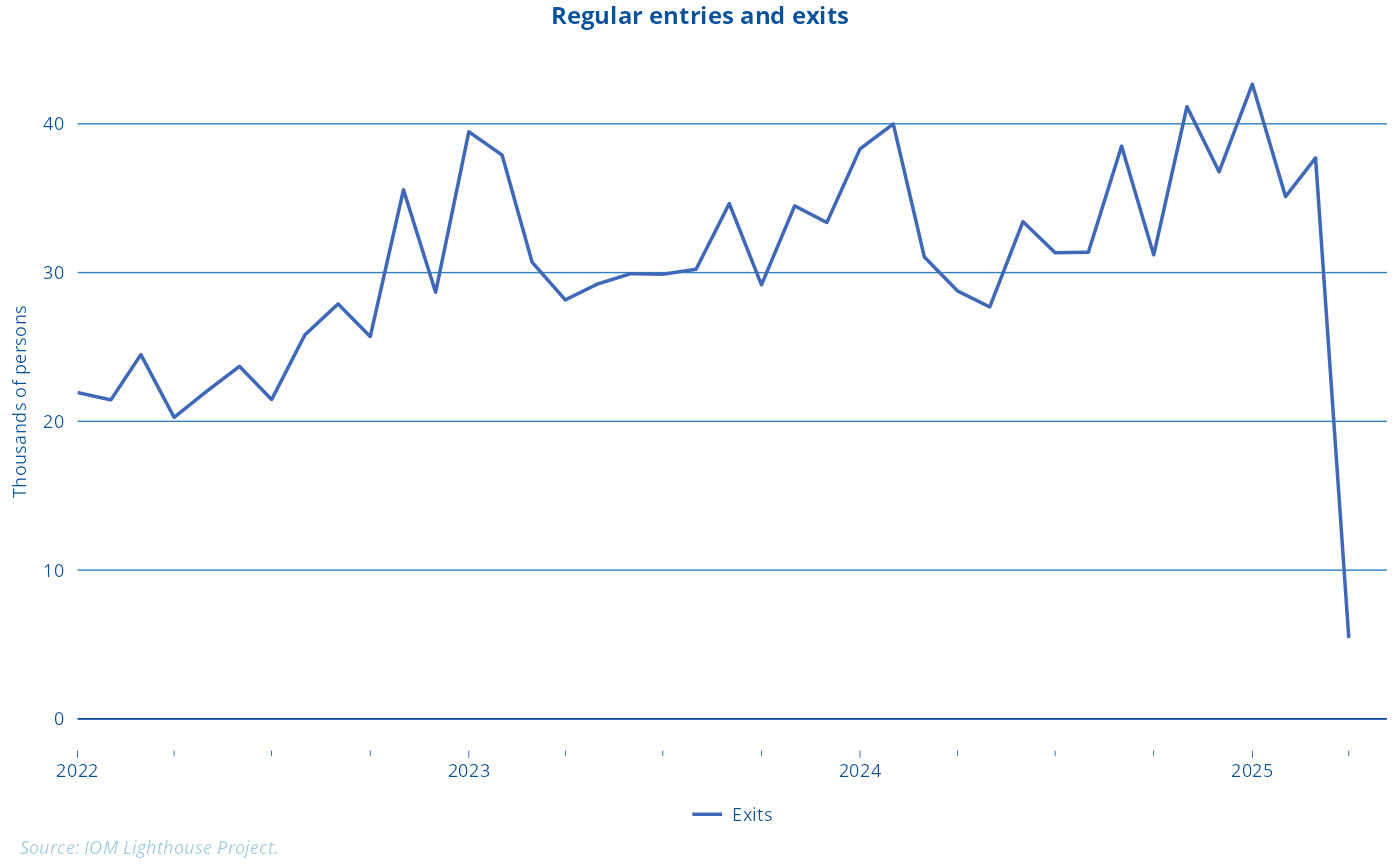
data <- digest_data("regflow", iso = "USA")
knitr::kable(data)| geo | t | n | var |
|---|---|---|---|
| USA | 2022 Jan | 381231 | Exits |
| USA | 2022 Feb | 288707 | Exits |
| USA | 2022 Mar | 401961 | Exits |
| USA | 2022 Apr | 381597 | Exits |
| USA | 2022 May | 351002 | Exits |
| USA | 2022 Jun | 398872 | Exits |
| USA | 2022 Jul | 466603 | Exits |
| USA | 2022 Aug | 435972 | Exits |
| USA | 2022 Sep | 295678 | Exits |
| USA | 2022 Oct | 292705 | Exits |
| USA | 2022 Nov | 344509 | Exits |
| USA | 2022 Dec | 355080 | Exits |
| USA | 2023 Jan | 559791 | Exits |
| USA | 2023 Feb | 462003 | Exits |
| USA | 2023 Mar | 560053 | Exits |
| USA | 2023 Apr | 465102 | Exits |
| USA | 2023 May | 400236 | Exits |
| USA | 2023 Jun | 474840 | Exits |
| USA | 2023 Jul | 572647 | Exits |
| USA | 2023 Aug | 515596 | Exits |
| USA | 2023 Sep | 352057 | Exits |
| USA | 2023 Oct | 350213 | Exits |
| USA | 2023 Nov | 442734 | Exits |
| USA | 2023 Dec | 496298 | Exits |
| USA | 2024 Jan | 659955 | Exits |
| USA | 2024 Feb | 554318 | Exits |
| USA | 2024 Mar | 660935 | Exits |
| USA | 2024 Apr | 538093 | Exits |
| USA | 2024 May | 467166 | Exits |
| USA | 2024 Jun | 561303 | Exits |
| USA | 2024 Jul | 612978 | Exits |
| USA | 2024 Aug | 543567 | Exits |
| USA | 2024 Sep | 380312 | Exits |
| USA | 2024 Oct | 359245 | Exits |
| USA | 2024 Nov | 441231 | Exits |
| USA | 2024 Dec | 539427 | Exits |
| USA | 2025 Jan | 523994 | Exits |
| USA | 2025 Feb | 414055 | Exits |
| USA | 2025 Mar | 558969 | Exits |
| USA | 2025 Apr | 122173 | Exits |
digest_plot
# Generate a plot for USA
p1 <- digest_plot(key="regflow", iso = "USA")

p1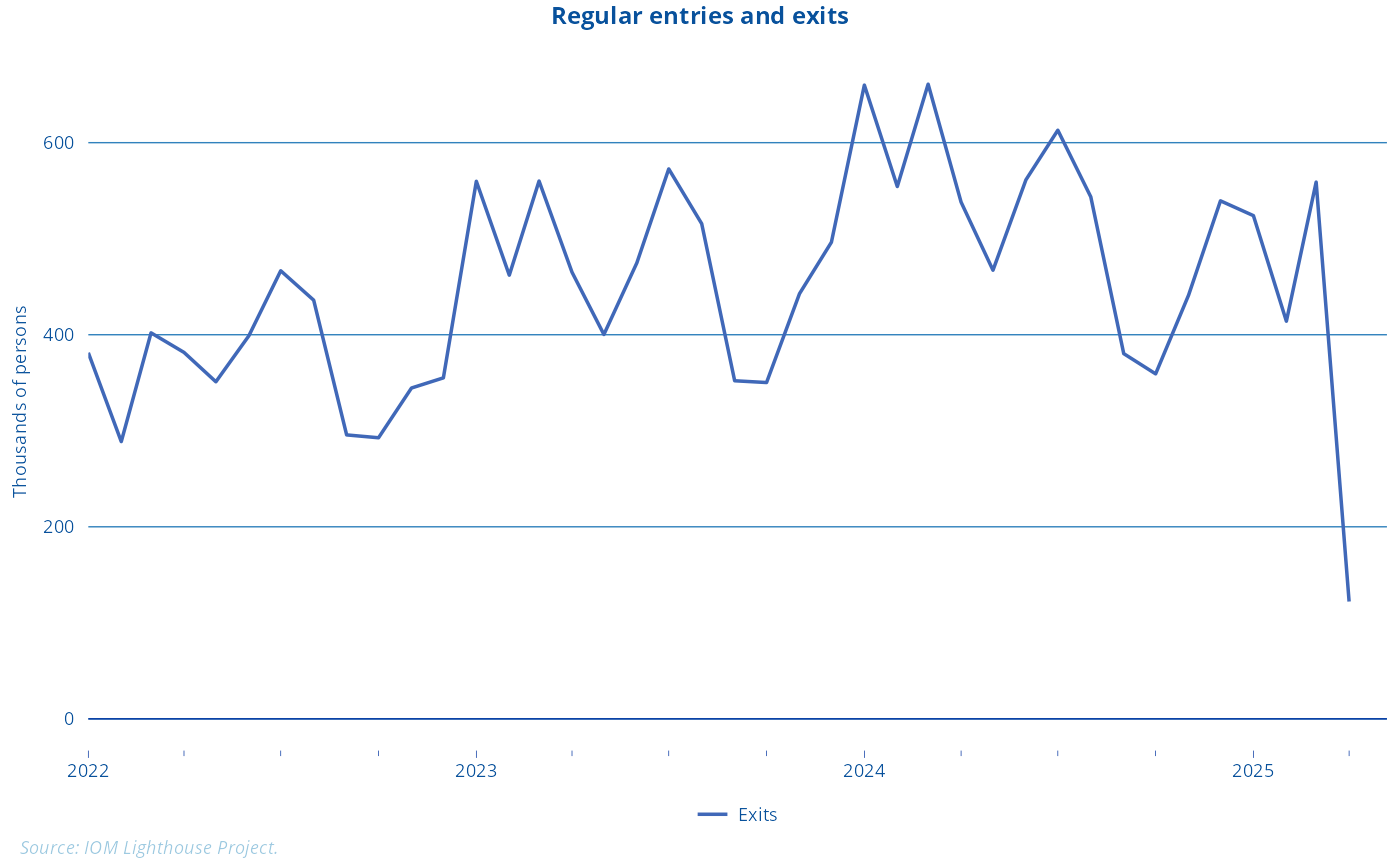
# Test error catching
p2 <- digest_plot(key="regnet", iso = "USA")
p2
caption_placeholder
cat(caption_placeholder(1))  # One-column placeholder caption
#> - Lorem ipsum dolor sit amet, consectetur adipiscing elit. Nunc dignissim nec tellus sit amet cursus. Nam justo risus, dapibus in massa vitae, dictum feugiat elit.
#>  - Curabitur fermentum vehicula urna ac fringilla. Integer interdum orci vehicula volutpat maximus. Duis gravida vestibulum ex nec fermentum. Fusce sed aliquet ante, at ultrices leo.
cat(caption_placeholder(2))  # Two-column placeholder caption (default)
#> - Lorem ipsum dolor sit amet, consectetur adipiscing elit. Nunc dignissim nec tellus sit amet cursus. Nam justo risus, dapibus in massa vitae, dictum feugiat elit.
#>  - Curabitur fermentum vehicula urna ac fringilla. Integer interdum orci vehicula volutpat maximus. Duis gravida vestibulum ex nec fermentum. Fusce sed aliquet ante, at ultrices leo.
#>  #colbreak()
#>  - Donec lectus urna, aliquam nec posuere quis, faucibus ac ligula. Phasellus tristique tortor eget urna scelerisque vehicula. Phasellus eu blandit felis, ac molestie neque. Vestibulum posuere leo at risus aliquam convallis.
#>  - Ut leo ante, faucibus vitae elit at, vulputate laoreet ligula. Sed dolor erat, ultricies eget fermentum vel, semper id nulla. Morbi sit amet feugiat ipsum.
cat(caption_placeholder(3))  # Three-column placeholder caption
#> - Lorem ipsum dolor sit amet, consectetur adipiscing elit. Nunc dignissim nec tellus sit amet cursus. Nam justo risus, dapibus in massa vitae, dictum feugiat elit.
#>  #colbreak()
#>  - Curabitur fermentum vehicula urna ac fringilla. Integer interdum orci vehicula volutpat maximus. Duis gravida vestibulum ex nec fermentum. Fusce sed aliquet ante, at ultrices leo.
#>  #colbreak()
#>  - Donec lectus urna, aliquam nec posuere quis, faucibus ac ligula. Phasellus tristique tortor eget urna scelerisque vehicula. Phasellus eu blandit felis, ac molestie neque. Vestibulum posuere leo at risus aliquam convallis.